

Lattice is in beta. It is available to Enterprise customers and is enabled on request. Talk to sales to turn it on for your organization.
- Resolves the same person across records. An email, phone, profile URL or domain that appears in several rows becomes one entity, so those rows connect through it. Lattice merges two people when the evidence shows they are the same person, such as a shared email. When it isn’t sure, it asks you under Same entity? instead of guessing. It never merges people on name alone.
- Maps relationships. Select any entity to see everything connected to it: who shares a phone, an employer, a city or an IP address.
What it’s built for
- Mapping connections. See everything tied to a person, company, email or phone across all your records, and who else shares it.
- Finding clusters and rings. Find groups of “different” accounts that reuse the same phone, email, address or IP address. Use it for fraud checks, duplicate cleanup and vetting.
Before you start
- Opening and exploring a graph needs you to sign in to the web app. Use a team API key to match incoming rows, look up records and manage labels programmatically. Lattice API
- For organizations with customer-managed encryption, Lattice needs a one-time setup. Contact support@sixtyfour.ai to enable it.
- A graph belongs to the team that created it. It is listed only in that team, and only that team’s runs can add to it.
- Graph names are unique within a team, so two teams can each have a graph with the same name. To run by API, use an API key from the graph’s team.
Build your first graph
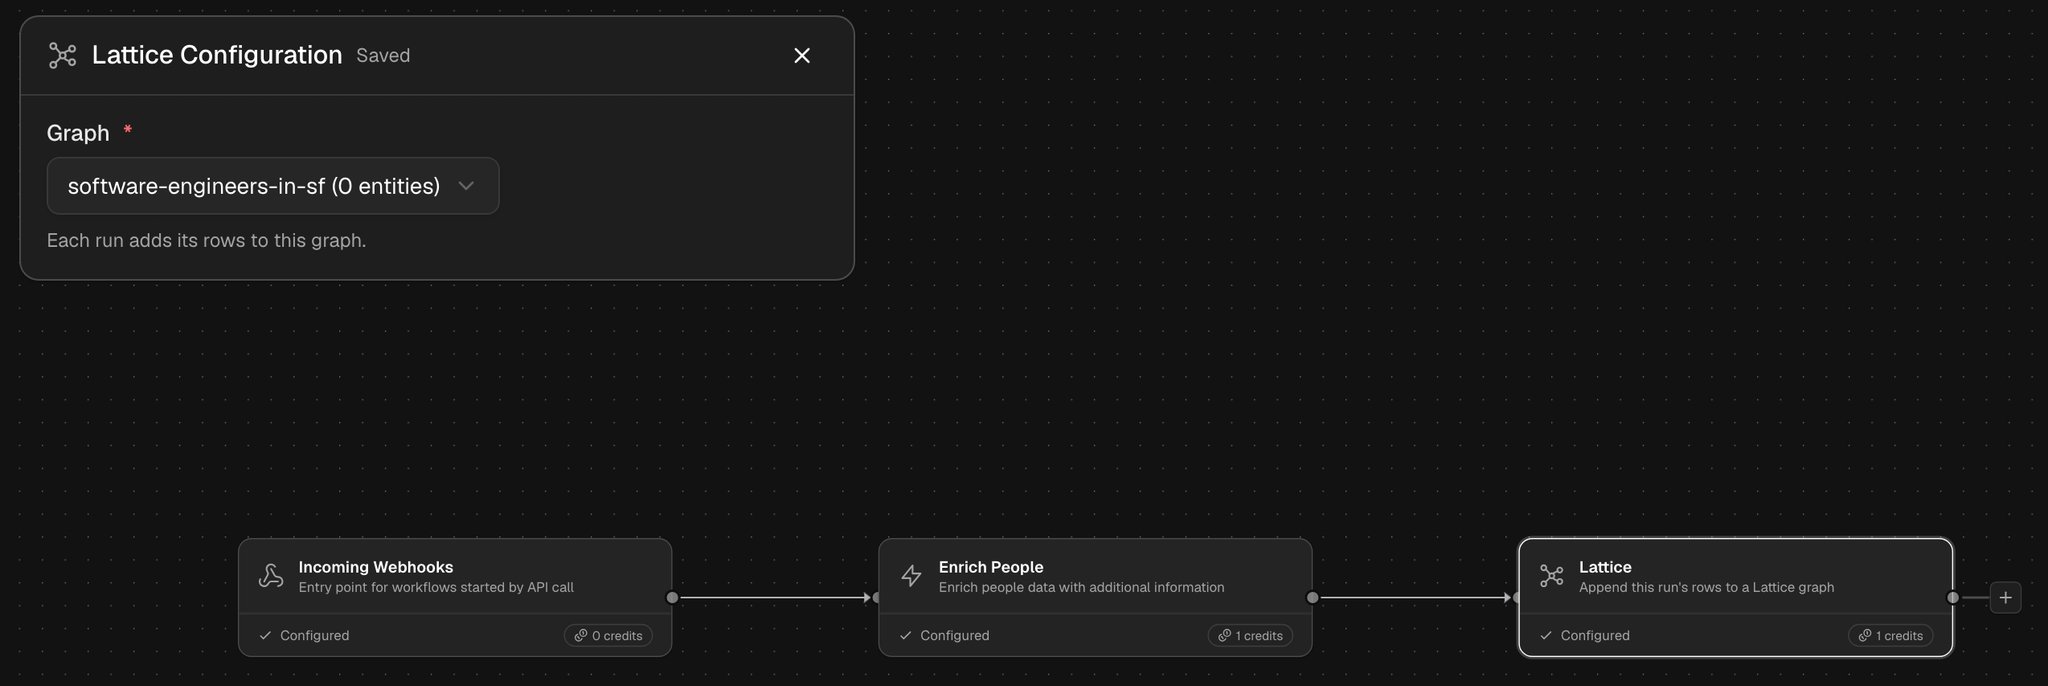
You build graphs in workflows, by adding a Lattice block to the end of a workflow.- Open Workflows and open a workflow that produces rows of people or companies. To start a new one, add a source such as Import Data or Search.
- Add Lattice, under Send Results, as the last block and connect it.
- In the block, select Create a new graph…, type a name, such as
software-engineers-in-sf, and select Create. To add this run to a graph you already have, select that graph instead. - Select Run workflow, check the cost estimate, and start the run.
- When the run finishes, open Lattice in the sidebar and select your graph’s card.
Explore the graph
A graph opens in table view. Browse entities by type, search, filter and sort. To open graph view, select any entity to see the nodes connected to it, or select Show all in the top right to see the whole graph.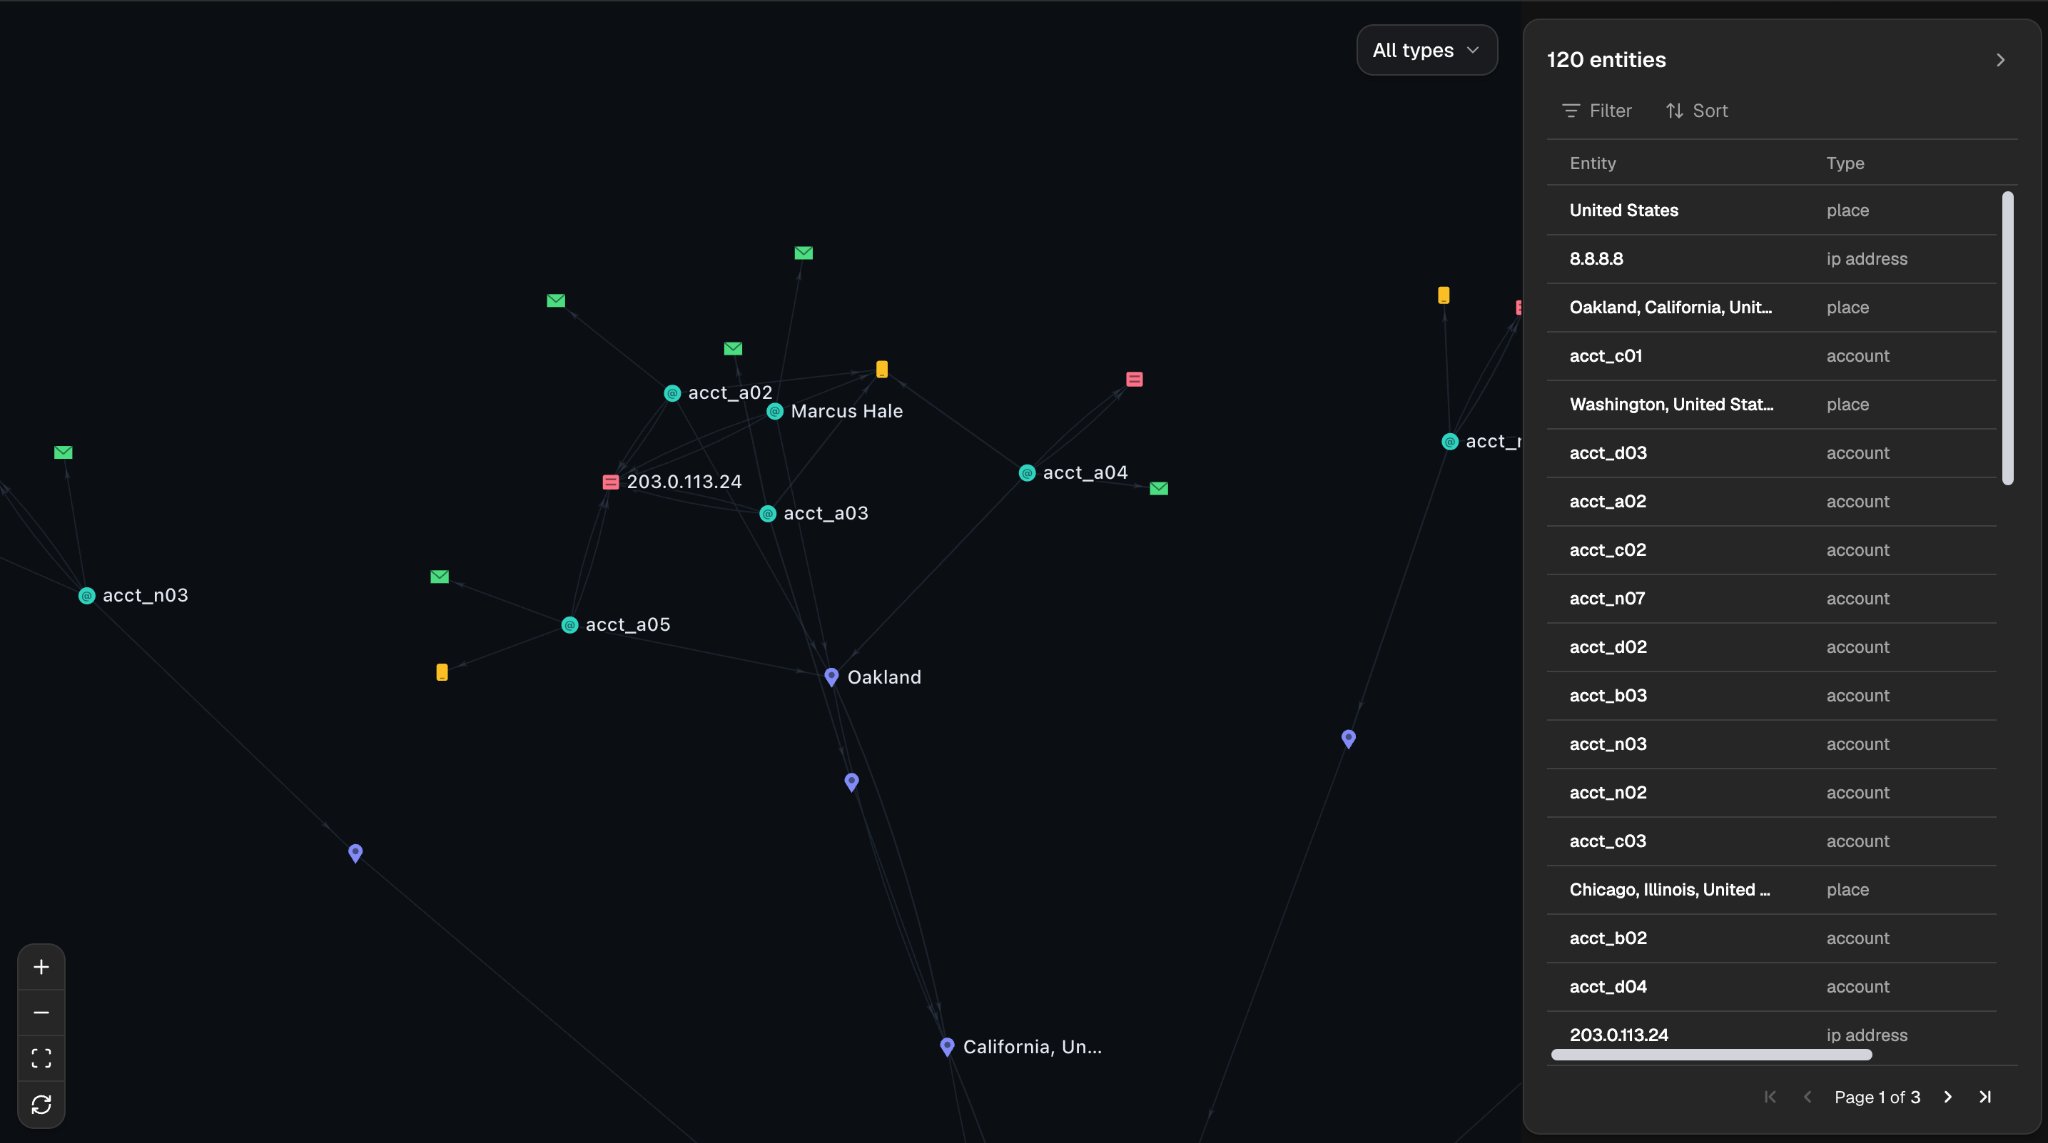
Example: a shared IP address cluster
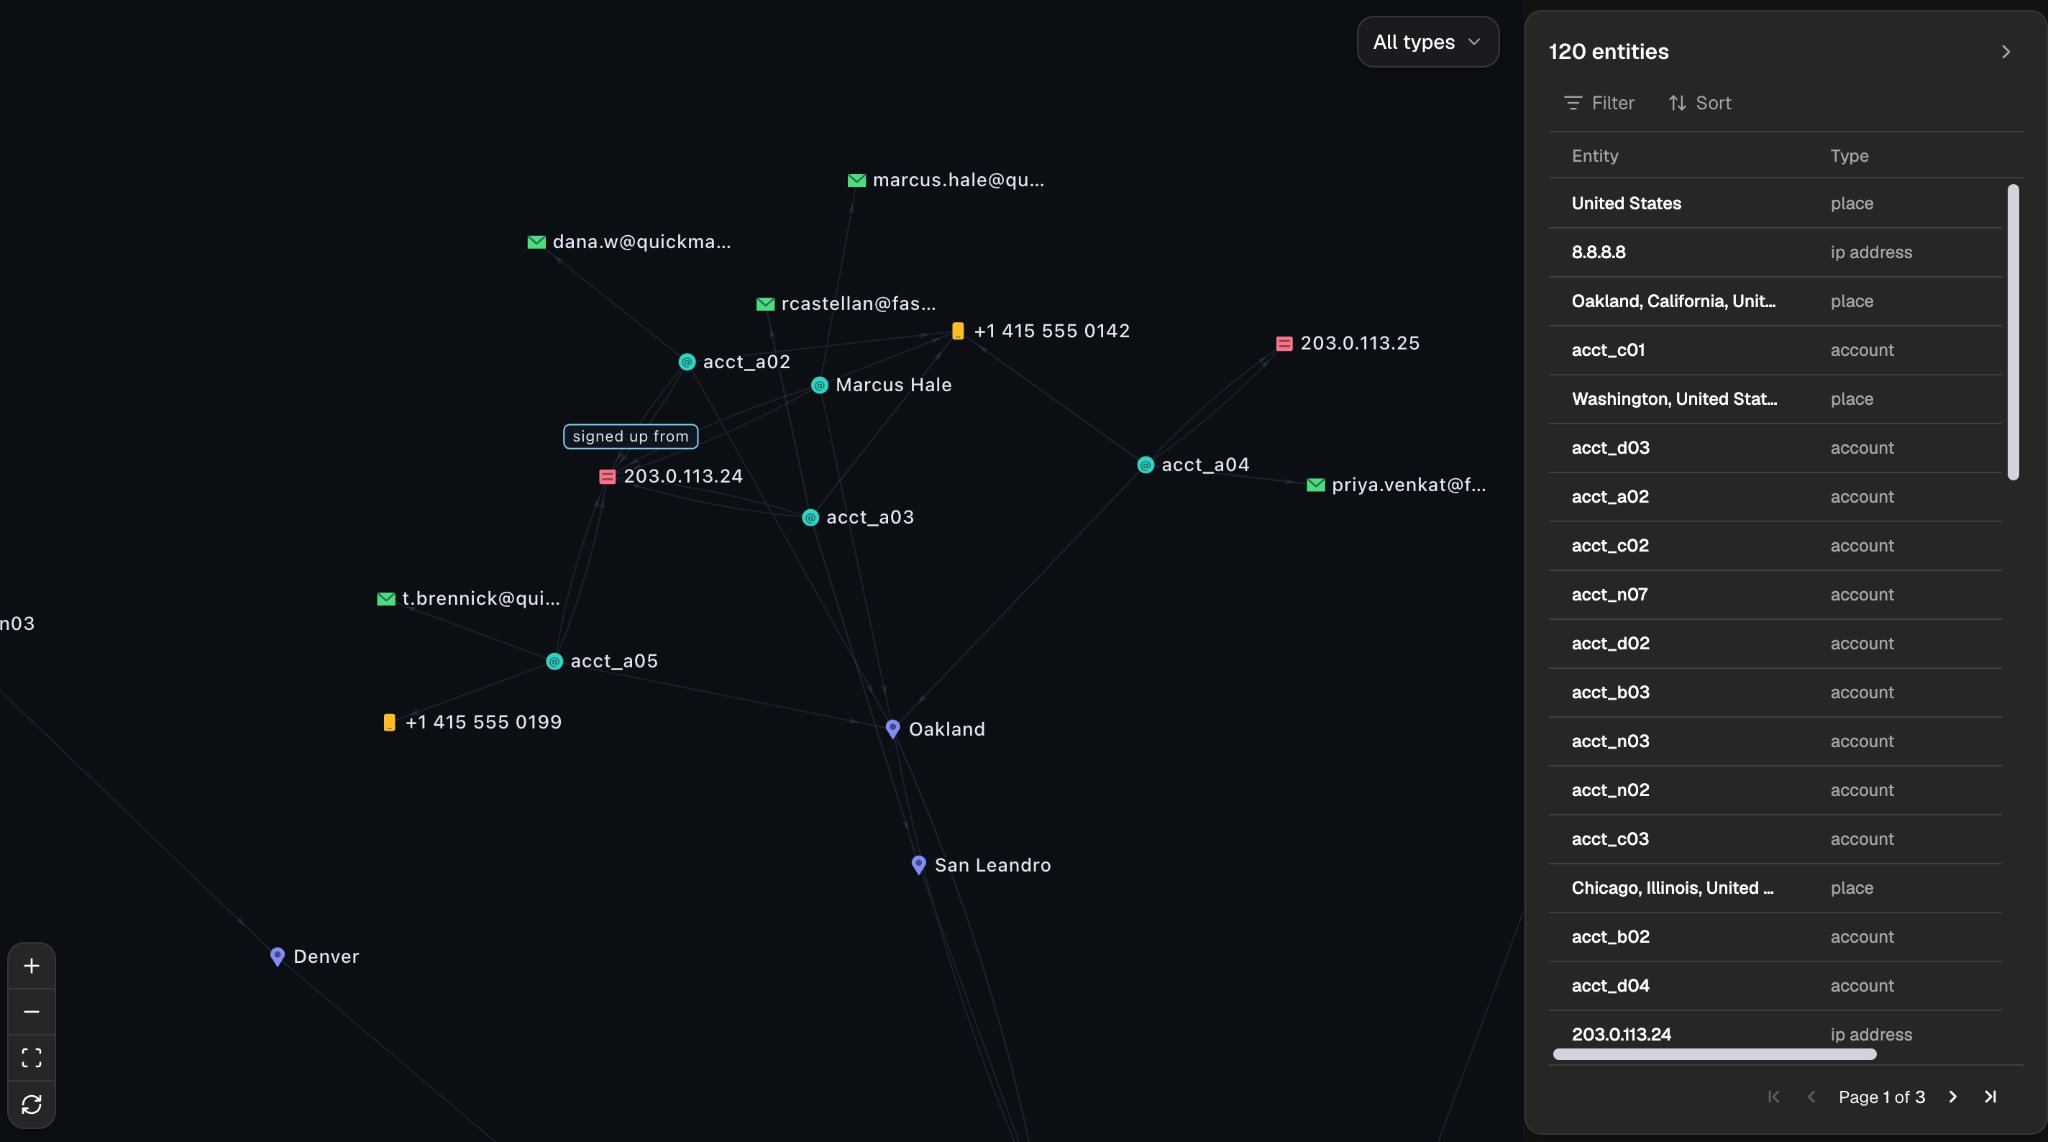
Use a graph to find accounts that look unrelated but reuse the same details. In this sample data, each row is one account. Four accounts signed up from the same IP address,203.0.113.24, and several of them also share a phone number. Neither pattern shows up when you read the rows one at a time.
Run it by API
Build the workflow once in the web app, starting from an Import Data block, then run it by API with a new file each time: upload the file, then start a run with itsfile_id. See Workflows for more on running workflows by API.
job_id:
HTTP 202
succeeded, failed or canceled. Workflow Execution describes every Job field.